Monthly Archives: January 2009

Violent Moves in Bonds and Gold

This week saw some very interesting turns in the market. Stocks displayed some renewed weakness. Treasury bonds sold off violently and gold broke out of a consolidation pattern to the upside, taking out the $880 mark which has served as a ceiling through much of its correction in the 2H of 2008.

It’s important to note that while gold is off the highs in US Dollar terms ($1,000), it has broken out to new highs in almost every other global currency – the UK Pound and Euro included. This is indicative of a strong bull market in gold and also shows that global confidence in world currencies is sinking as central banks resort to the printing press to solve our problems. Bad move, considering the printing presses are what got us into the problems in the first place.

I believe the only reason that gold has not made new highs in 2008 in U.S. Dollar terms is because of the artificial flight-to-quality into the US Dollar, which is most likely a short-term phenomenon. Now, I have not always been a “whacked out gold bug,” but I am gaining new confidence in the case for the gold bull market to enter its strongest phase: panic buying. We are now in the eighth year of a strong gold bull market, which is likely to continue for, in my estimation, at least another 3 years. Gold has averaged a 16% annual gain in Dollar terms for the past 8 years. Clearly it is the best performing asset class in the decade. You might ask if its getting late in the move, but the fundamentals are still supportive.

The gold bull market is reflective of how dependent our governments have become on creating and pushing debt on its people – a trend that is  accelerating. Because of the breakout of the gold and strength in mining stocks, I would recommend at looking to buy some of the mining and exploration stocks including RGLD, PAAS, NEM, and AUY.

You can also buy a basket of mining stocks with GDX. This sector was crushed in the October/November sell-off, but it is now bouncing back violently with mining asset prices being supported by the moves in gold and silver. This will be a careful area to watch because these stocks have established early leadership in 2009.

Another interesting trend to watch is that commodities are displaying renewed strength, especially in relation to equities. This week commodities and hard assets outperformed equities. Could this be a sign of a trend that will be established in 2009? It is something that bears close watching. The chart below shows the potential for an interesting turn in the commodities sector.

INDEX NAME VALUE CHANGE OPEN HIGH LOW TIME
 UBS BLOOMBERG CMCI 898.98 26.86 873.21 903.43 866.80 01/23
 S&P GSCI 350.51 12.97 331.76 352.83 329.43 01/23
 RJ/CRB Commodity 225.79 7.10 218.78 226.05 217.86 01/23
 Rogers Intl 2554.60 94.00 2444.75 2571.84 2419.09 01/23
 

Energy

  PRICE CHANGE %CHANGE TIME
  BRENT CRUDE FUTR (USD/bbl.) 48.370 2.980 6.57 01/23
  GAS OIL FUT (ICE) (USD/MT) 424.000 -2.750 -0.64 01/23
  GASOLINE RBOB FUT (USd/gal.) 115.440 6.100 5.58 01/23
  HEATING OIL FUTR (USd/gal.) 145.050 10.190 7.56 01/23
  NATURAL GAS FUTR (USD/MMBtu) 4.518 -0.163 -3.48 01/23
  WTI CRUDE FUTURE (USD/bbl.) 46.470 2.800 6.41 01/23
 

Agriculture

  PRICE CHANGE %CHANGE TIME
  COCOA FUTURE – LI (GBP/MT) 2025.000 56.000 2.84 01/23
  COCOA FUTURE (USD/MT) 2661.000 81.000 3.14 01/23
  COFFEE ‘C’ FUTURE (USd/lb.) 119.650 0.200 0.17 01/23
  CORN FUTURE (USd/bu.) 390.500 3.000 0.77 01/23
  COTTON NO.2 FUTR (USd/lb.) 50.640 1.710 3.49 01/23
  FCOJ-A FUTURE (USd/lb.) 74.900 -0.900 -1.19 01/23
  SOYBEAN FUTURE (USd/bu.) 1009.000 -3.000 -0.30 01/23
  SOYBEAN MEAL FUTR (USD/T.) 318.300 0.100 0.03 01/23
  SOYBEAN OIL FUTR (USd/lb.) 33.600 0.070 0.21 01/23
  SUGAR #11 (WORLD) (USd/lb.) 12.700 0.320 2.58 01/23
  WHEAT FUTURE(CBT) (USd/bu.) 582.750 16.000 2.82 01/23
  WHEAT FUTURE(KCB) (USd/bu.) 610.500 12.500 2.09 01/23
 

Industrial Metals

  PRICE CHANGE %CHANGE TIME
  ALUMINUM FUTURE (USd/lb.) 62.250 0.500 0.81 01/23
  COPPER FUTURE (USd/lb.) 147.200 7.600 5.44 01/23
 

Precious Metals

  PRICE CHANGE %CHANGE TIME
  GOLD 100 OZ FUTR (USD/t oz.) 897.700 37.200 4.32 01/23
  SILVER FUTURE (USD/t oz.) 11.940 0.575 5.06 01/23
 

Livestock

  PRICE CHANGE %CHANGE TIME
  CATTLE FEEDER FUT (USd/lb.) 92.750 0.450 0.49 01/23
  LEAN HOGS FUTURE (USd/lb.) 64.400 -1.000 -1.53 01/23
  LIVE CATTLE FUTR (USd/lb.) 85.800 0.400 0.47 01/23
 

Inauguration Lamentation

Okay, new President.

Don’t you hate when on a day when all the world is allegedly going to “celebrate hope and change,” the markets take a big nosedive.

Dick Cheney gets wheeled off in a wheelchair and Senator Kennedy has a seizure at the inaugural luncheon.

Some start to the Obama Adminstration!

Sure, I know. In the scheme of things, it means nothing. And today was  a day to celebrate America. But, there was that issue of the red ink.

The most distrubing thing about today is that you had formally respectable banks like Royal Bank of Scotland and State Street tanking north of 50%. That is frightening stuff.

Royal Bank of Scotland. Isn’t that one of the banks your conservative Uncle Ernie in Pittsburg always told you to buy.? Sensible bankers, those Scots.  Until they become insolvent.

Elsewhere in the great casino, there was lots of action. Oil continues to go through pops and drops, depending on which month contract you are playing. The front-month, February, which is expiring, rallied nearly two beaners. But the next month, March, got whacked 2 beaners at the same time. There’s nearly a $10 difference between the February and March contracts. Will oil be that much more difficult to get in one month? To me these are signs that oil are trying to bottom. I have established some small initial long oil position.

The dollar was skyrocketing against most currencies, but gold still rose $20. I find this interesting. Are people starting to realize that all paper currencies are, in fact, made out of paper?

Below is so more action in the futures arena. Generally, it was not a good day to trade, unless you were shorting the christmas out of the S&Ps. other stuff was fidgety, volatile, and without discernable trend. Though it’s certain that commodities are still a dangerous place to be. Be careful out there.


Commodity Futures

INDEX NAME VALUE CHANGE OPEN HIGH LOW TIME
 UBS BLOOMBERG CMCI 884.85 -21.54 881.80 901.50 881.14 01/20
 S&P GSCI 330.79 -12.31 328.30 343.46 326.10 01/20
 RJ/CRB Commodity 215.88 -5.21 220.40 221.09 215.88 01/20
 Rogers Intl 2429.92 -75.35 2435.86 2504.19 2408.55 17:50
 

Energy

  PRICE CHANGE %CHANGE TIME
  BRENT CRUDE FUTR (USD/bbl.) 43.800 0.180 0.41 20:35
  GAS OIL FUT (ICE) (USD/MT) 437.250 -9.750 -2.18 20:34
  GASOLINE RBOB FUT (USd/gal.) 114.000 -0.310 -0.27 19:01
  HEATING OIL FUTR (USd/gal.) 139.100 1.520 1.10 19:12
  NATURAL GAS FUTR (USD/MMBtu) 4.723 0.081 1.74 20:36
  WTI CRUDE FUTURE (USD/bbl.) 41.100 0.260 0.64 20:39
 

Agriculture

  PRICE CHANGE %CHANGE TIME
  COCOA FUTURE – LI (GBP/MT) 1866.000 86.000 4.83 01/20
  COCOA FUTURE (USD/MT) 2470.000 7.000 0.28 01/20
  COFFEE ‘C’ FUTURE (USd/lb.) 114.900 -0.900 -0.78 01/20
  CORN FUTURE (USd/bu.) 384.000 0.500 0.13 20:57
  COTTON NO.2 FUTR (USd/lb.) 46.810 -2.190 -4.47 01/20
  FCOJ-A FUTURE (USd/lb.) 72.250 0.150 0.21 01/20
  SOYBEAN FUTURE (USd/bu.) 996.250 4.250 0.43 20:56
  SOYBEAN MEAL FUTR (USD/T.) 309.500 0.500 0.16 20:57
  SOYBEAN OIL FUTR (USd/lb.) 33.870 0.060 0.18 20:58
  SUGAR #11 (WORLD) (USd/lb.) 12.590 0.330 2.69 01/20
  WHEAT FUTURE(CBT) (USd/bu.) 553.500 3.500 0.64 20:57
  WHEAT FUTURE(KCB) (USd/bu.) 583.750 4.000 0.69 20:34
 

Industrial Metals

  PRICE CHANGE %CHANGE TIME
  ALUMINUM FUTURE (USd/lb.) 64.300 -3.250 -4.81 01/20
  COPPER FUTURE (USd/lb.) 150.800 0.350 0.23 20:38
 

Precious Metals

  PRICE CHANGE %CHANGE TIME
  GOLD 100 OZ FUTR (USD/t oz.) 850.200 -5.000 -0.58 20:38
  SILVER FUTURE (USD/t oz.) 11.155 -0.020 -0.18 20:39
 

Livestock

  PRICE CHANGE %CHANGE TIME
  CATTLE FEEDER FUT (USd/lb.) 91.775 0.025 0.03 19:27
  LEAN HOGS FUTURE (USd/lb.) 65.925 0.225 0.34 19:39
  LIVE CATTLE FUTR (USd/lb.) 85.200 -0.150 -0.18 20:41
 

Money Supply is Key to Watch

I love the raging debate going on between the deflationists and the inflationists. I would categorize myself as an inflationist who is waiting for signs that disinflation is ending. Once the change in trend is confirmed it’s time to make larger bets! Is that enough of a hedge?

I have started to make some inflationary bets — long gold & silver, short bonds, mostly — and I would like to increase them. However, I would like some of the data — and the market’s reaction to the data — confirm some of these theories before I act on them further.

 Let me simplify it in these terms: What we currently have is a deflationary phase of the economy, driven by weakening economic activity as well as deleveraging of investment assets. The government is desperately trying to “reflate” the economy by guaranteeing banks, lowering rates, creating stimulus, and driving down interest rates. So far, it’s done little, but these things always have a lag.  Credit as measured by a number of indicators has loosened up a bit since last October.

The  mode could change quickly from deflation to inflation if all of the monetary stimulus created by the central banks starts to work itself back into the economy. Make no mistake about it: they have created a lot of new money. The problem is that this money has been locked up in banks.

Some smart people have been watching and analyzing the money supply data for hints as to how this deflation/inflation warfare will play out. The first is John Williams, the economist who runs the brilliant site www.shadowstats.com. Williams does a lot of work to filter the news out of government statistics and figure out what is actually happening. His recent work shows that his measure of “M3” or broad money supply, is accelerating. From his Web site:

“M3 Growth Surges. With full reporting in place for the month of December, annual growth was higher across the board for M1, M2 and the SGS-Alternate Measure of M3. For December, annual M3 growth surged to roughly 10.7% from its recent trough of 9.1% in November.”

Source: www. shadowstats.com (full site access requires subscription)

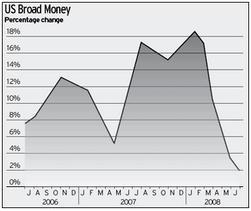
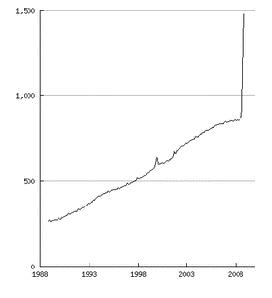
This is important, because until December of 2008, measures of M3 had been shrinking — reflecting the deflationary nature of the credit contraction. Williams thesis is that it appears that this credit contraction may be waning, and that  a turn in M3 will unleash the  huge explosion in “M1” money suppply, fueling a surge in inflation.

As you can see by the charts below — M3 and M1 have been “fighting each other” — headed in different directions. The decline in M3 has overwhelmed the surge in M1, causing deflation. But if M3 now turns up, what you have is an overwhelming surge in both measures pushing toward the inflation direction.

US Broad Money Supply (M3)

US Broad Money Supply (M3)

St. Louis Fed M1 measure

Source: St. Louis Fed M1 measure


Ed Seykota, the master trader,  recently posted these charts on his Web site, Trading Tribe (www.tradingtribe.com).  Seykota is usually very cagey about his specific trading ideas or economic theories, but he implied that his is watching money supply carefully for inflationary implications. You can read some of his commentary in his FAQ here.

The Wild and Wooly Dollar

Lots of action this morning. Stock futures are down, ostensibly related to weak data from ADP forecasting — get this — more job losses. What a surprise!

Let’s forget for a moment that the ADP data has been a terrible indicator over time. What this really is about is the market grappling with the timing of the “employment bottom.”

The U.S. Dollar, for simlilar reasons, has been incredibly volatile. I believe this is because the market is toggling between the “We are doing more to fix the problem and our economy will recover first” idea and the “We are sowing the seeds of massive inflation” idea.

In short, dollar bulls think that if the stimulus, TARP, and various rescue packages work, we will recover and tax revenues will surge to help allay fears of massive deficits.

Well, fine, but didn’t Obama say that we will have “Trillions of dollars of deficits for years to come”? This is not like the 1990s, where a strong and productive economy will produce a surplus. We are taking on trillions of dollars in liabilities, which is likely to weigh on the Federal Balance Sheet for decades to come. In time, I don’t see how the dollar can possibly stay strong.

I think that is why every morning when I wake up, I’m not suprised at all to see massive currency moves, as the global markets “freak out” about how all this money printing will sort itself out. Currency volatility is likely to be a regular feature of the market in 2009.

At any rate, technically it’s in a bounce, if if you look at this fine chart by Clive Maund, we can see that the Dollar Index can rally up to 84-85 and still maintain a possible “breakdown” technical picture.

jan052009_2

Markets Today

Schizoid day today.

The highlights are :

* US Dollar Strength

* Positive action in the grains

* Dismal economic news. But stocks have whipsawed and are trying to catch a bid to remain in the “big bounce” from the abyss.

This morning I didn’t do much of anything but I added a small amount to my long silver position. I am short the treasuries and watching them carefully. They are looking a bit dicey here.

Energy

  PRICE CHANGE %CHANGE TIME
  BRENT CRUDE FUTR (USD/bbl.) 50.630 1.010 2.04 11:59
  GAS OIL FUT (ICE) (USD/MT) 521.250 37.250 7.70 11:59
  GASOLINE RBOB FUT (USd/gal.) 119.430 1.190 1.01 11:39
  HEATING OIL FUTR (USd/gal.) 162.890 5.260 3.34 11:39
  NATURAL GAS FUTR (USD/MMBtu) 6.060 -0.012 -0.20 11:39
  WTI CRUDE FUTURE (USD/bbl.) 48.900 0.090 0.18 11:39
 

Agriculture

  PRICE CHANGE %CHANGE TIME
  COCOA FUTURE – LI (GBP/MT) 1787.000 -15.000 -0.83 11:49
  COCOA FUTURE (USD/MT) 2610.000 55.000 2.15 11:59
  COFFEE ‘C’ FUTURE (USd/lb.) 115.400 7.700 7.15 11:59
  CORN FUTURE (USd/bu.) 420.250 9.000 2.19 11:59
  COTTON NO.2 FUTR (USd/lb.) 49.700 1.390 2.88 11:58
  FCOJ-A FUTURE (USd/lb.) 76.250 1.550 2.07 11:52
  SOYBEAN FUTURE (USd/bu.) 1004.000 17.000 1.72 11:59
  SOYBEAN MEAL FUTR (USD/T.) 300.800 2.600 0.87 11:59
  SOYBEAN OIL FUTR (USd/lb.) 36.360 1.190 3.38 11:59
  SUGAR #11 (WORLD) (USd/lb.) 12.240 0.420 3.55 11:59
  WHEAT FUTURE(CBT) (USd/bu.) 633.500 16.750 2.72 11:59
  WHEAT FUTURE(KCB) (USd/bu.) 655.000 12.750 1.99 11:59

Source: Bloomberg.com

Investment Outlook 2009

“Inflation is taxation without legislation.”
   — Milton Friedman 

Greetings Investors,  Happy New Year! It’s time to catch up on the serious developments in  the financial markets.  I have been running a private investment advisory newsletter in which I pick a “Top Ten” Portfolio for four years now. In 2008, I did not issue a “Top Ten” portfolio based on the fact  that I thought it would be a very difficult year to invest. As we  now know, that may have been the understatement of the century.

Twelve months later, as we start 2009, the investment landscape has  changed dramatically. The investment banking industry has been  obliterated. Fannie Mae, the largest mortgage buyer on the planet,  has been taken over by the U.S. government. The federal government  has expanded its balance sheet to over $1 Trillion (the truth is,  nobody knows by exactly how much) and is taking large stakes in  private businesses. We’re becoming “Francified” as the country moves  toward large-scale socialization of industry.

Where does it all lead? Unfortunately, Americans aren’t very good at  making baguettes, so the “Francification” isn’t a good look for us.  As the government takes on more and more liabilities of the private  enterprise, prints up money, and seeks to bail out the economy by  the creation of new public debt, this could lead to the largest  inflationary bubble of our lifetime.

Nearly all asset classes were destroyed in 2008: Equities, corporate  bonds, municipal bonds, real estate, oil, industrial commodities.  Almost everything was down 40-60%. I guess we can take solace in the  fact that we weren’t Iceland, where the stock market declined 95%!  There were really only two places to hide: 1) Gold, of which I have  been a big fan (and still am), which ended the year up 5% 2)  Treasury bonds, which mounted their largest rally in history. 2009 will certainly throw a few curveballs.

I believe we will see a  “divergence in asset classes.” As the government prints more money,  expands its balance sheet, and becomes the public dumpster of all  toxic assets that caused the collapse in the market, savvy investors  are likely to run for the cover of assets that would hold their  value in an inflationary environment as global governments begin a  mad race to “print the most money.”

I believe  the “stuff” trade will be back on, as people protect themselves  against the coming inflation.  As Jim Rogers, the commodities  investor and founder of the Quantum fund has pointed out,  commodities do not have “impaired” fundamentals. That is, the  fundamentals for many commodities, especially agricultural  commodities, remain incredibly strong (for example, wheat stocks are  at their lowest point in history while global demand for food hits  new highs).

To sum up the problem: In 2009, you might not be able  to buy a new Escalade on bank credit, but you will need to eat and  buy food. Financial assets, including government balance sheets, are, in fact,  impaired. Nobody knows where the federal government balance sheet  will end up after this process, nor what it will be valued at.

Some  corporate earnings numbers are also big question mark, especially in  the retail sector. To invest in treasury bonds at this point for a  measly a 2% yield looks like one of the worst risk/reward trades in  history. In fact, I advocate:

* Shorting Treasury bonds and believe it  may be one of the best trading opportunities in a long time.

* Precious metals and agricultural commodities are likely to  outperform. 

* Energy will return, but likely later in the year, after  the precious metals and grains. It is interesting that major  diversified oil companies such as Chevron (CVX) has stabilized ahead  of crude oil, and we think that is a favorable sign for energy  stocks.

* The stock market could see a benefit from  the return to liquidity, and for that reason it would not surprise  me to see the market rally for the next 2-3 months. It is a good time to test the equity waters with some high- quality  dividend-producing stocks, if only because they are a decent hedge  against inflation and the dividend “pays you to wait.” But take it slow and easy! Dollar-cost averaging rules, and have a long time horizon.

* High-quality  corporate bonds are also interesting. Individual corporate bonds  take a lot of work to understand and I am no expert, therefore I am  going to stick with some reputable funds, including the BlackRock  Income Opportunity Trust. However, any stock market rally should be  seen skeptically and sold accordingly. I doubt that a new bull  market can emerge in 2009 because of issues with corporate profits. 

It’s unlikely that corporate profits will return to the giddy growth  of the 2003-2006 period because of under-investment and a consumer  that is returning to saving. Our stock picks are weighted to things  that might be impervious toward a prolonged recession, including  healthcare and biotech. In general, I am expecting that the stock  market will be a trader’s market in 2009, with violent chops up and  down.

This year, our first portfolio “goes to 11” because we like to add  another unit of diversification to our approach.  Without further ado, here is my “Top Ten Portfolio” for 2008.

Top Ten Portfolio 2009 – The “Macro Portfolio”

1) Gold – Either  iShares Gold (GLD) or gold futures (I prefer to play futures and physical)

2) Silver – Can be bought as 1) coins on eBay 2) iShares ETF (SLV) 3) Silver stocks like PAAS or SSRI 4) Silver futures (be careful, silver is notoriously volatile) 5) physical bars other than coines. Believe it or not, I own ALL OF THE ABOVE!
2) DBA – Powershares Agriculture ETF
3) BNA – Blackrock Income Opportunity Trust
4) BPT – BP Prudhoe Trust
5) CVX – Chevron
6) BMY – Bristol Myers
7) MCD – McDonalds
*) BDX – Becton Dickinson
9) GILD – Gilead Sciences
10) TBT – Double Short Treasury Bonds (Note: you are selling bonds short  when buying this ETF)

11) Corn & Wheat futures (those of you who can’t buy  futures can substitute DBA)